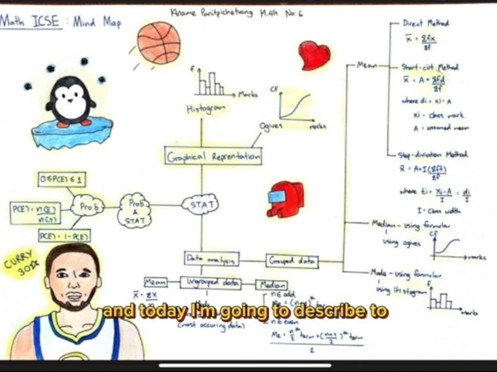
Mind Map on Probability and Statistics By Ms. Jubaiya Jahan
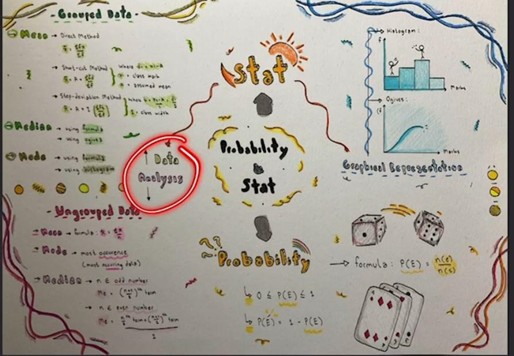
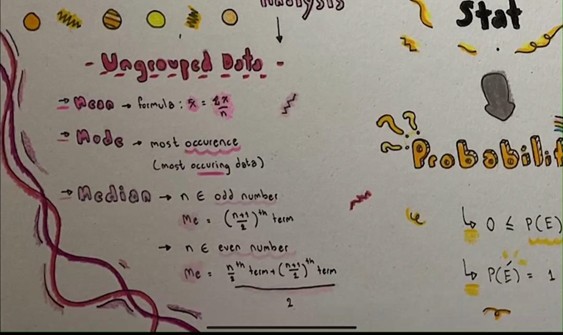
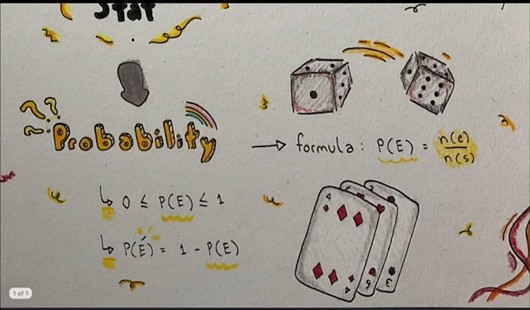
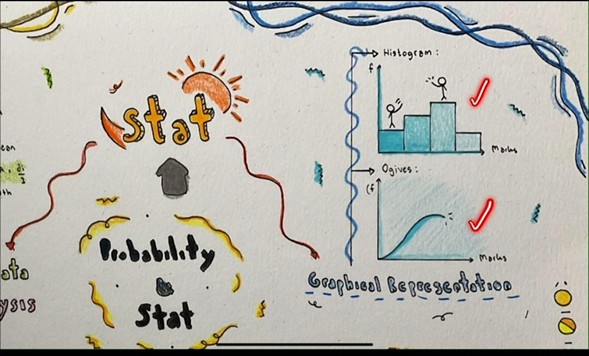
M4/1-M4/4 students are assigned an individual task to draw a mind map on probability and statistics and present the map in 10 minutes in English. To draw this map, students need to understand all the concepts in both the topics of probability and statistics. By doing this assignment, they learned about what probability is, what the range of probability is, and how to measure probability. On the other hand, by drawing the map on statistics, their concepts became clear about group data and up-group data. They also learned how to find out the mean, median, and mode for group data and ungroup data. Moreover, they also learned how to draw histograms, how to draw ogives, and how to find the mode using a histogram and median from an ogive. Lastly, since they had to present the assignment in English, it was a great opportunity for them to practice their spoken English. I am happy and proud that some of them did an excellent job, and most of them did it very well. Thank you very much to the students for their hard work.